Energy Insights

Harnessing data to simplify energy-saving decisions across stakeholders.

12
Weeks
Role
UX Research | Stakeholder Interviews
Wire-framing | UX Design
4
Team
Tools
Miro | Figma | Notion
Overview
Company
Energy Systems Network (ESN) is an Indianapolis-based non-profit organization that focuses on developing and deploying advanced energy technologies. One of their key initiatives is the Energy INsights program, an Indiana Economic Development Corporation (IEDC) sponsored effort to provide smart manufacturing starter kits to small and medium-sized manufacturers in Indiana.
Challenge
How might we empower diverse user groups to make informed energy efficiency decisions and actions while minimizing communication time and dependency?
Solution
Leveraging intuitive visualizations and interactive workflows streamlines communication for informed decision-making, empowering operators to excel in their roles.
Solution
1
Display issues along with visualization and provide resolution steps for operators to resolve the issues quickly and effectively.
2
Provide access to training modules, energy efficiency guides and resources.
Initial Problem
What problem is being solved?
Resolution Time | Increase Accessibility | User Trust
Reducing resolution time enables operators to address issues quickly without relying on plant managers, improving efficiency. Increasing accessibility through visual cues and better navigation enhances system effectiveness. Building user trust with information sources and customizable solutions promotes autonomous decision-making, reducing costs and optimizing energy efficiency processes.

Initial Problem Discovery
How was the problem discovered?
Research | Stakeholder Interviews | User Interviews
1
2
Total number of interviews
3
Developer
Integrator
"At the operator level, they should just be able to infer the information and make decisions."
- Developer
"Operators can make decisions on their own, but there can be training that can happen or protocols that can be followed ."
- Integrator
Initial Research/ Problem Validation
Understanding the Problem
Environmental Analysis | User Personas | User Journey
Desk research and secondary research were conducted to gain insights into the key market forces, trends, and macroeconomic factors influencing the competitive landscape. This external analysis was deemed essential for identifying the primary opportunities, threats, and strategic challenges facing participants across smart meter value chains. The research provided crucial perspectives on external factors shaping strategy, positioning, and investment decisions in the industry.
Market Research - Smart Manufacturing Market Size

Industry Forces - Gap in the Market
Product Functionalities
1. Monitoring & Control
2. Data Visualization
3. Alerts & Notifications
4. Scheduling & Automation
Opportunities
1. Integrated Training Modules
2. Access to Energy Efficiency Guides & Resources


User Personas
User personas for Jamie Palmer (operator) and Abram Weaver (plant manager) were instrumental in identifying specific pain points and needs in the energy management project. These personas informed the development of targeted solutions, including a customizable dashboard, AI-powered analytics, and energy efficiency guides, ensuring a user-centric approach to addressing challenges faced by both operators and plant managers.
User Journey Mapping
User journey mapping plays a crucial role in this scenario by providing valuable insights into the experiences and pain points of key stakeholders in the energy management process. In this case, the journey map highlights the challenges faced by both operators and plant managers when dealing with energy-related issues and dashboard interactions.
User Personas
Let’s step into the shoes of our user personas to understand them better.
Solution Discovery
Understanding the Solution
Crazy 8 | Solution Iterations | Feedback
User personas and journey mapping identified key pain points for operators and plant managers. The Crazy 8 design thinking method was employed to rapidly generate innovative solutions, pushing creative boundaries and exploring unconventional approaches to the problem.
Crazy 8 Design Thinking
Prototype Objectives
Autonomous Task Management:
Our dashboard empowers plant managers and operators to efficiently manage their own tasks and schedules without waiting for input from the other party.
Reduced Training Needs:
With access to comprehensive resources, operators can resolve issues independently, reducing the need for frequent training sessions and associated costs.
Streamlined Issue Resolution:
Plant managers can quickly identify issues and suggest solutions through the dashboard, expediting the decision-making process and problem resolution.
Digging deeper...
To better comprehend the solution and its development process, let's break it down into three key components. This approach will provide insight into how we conceived and refined each feature, ensuring a comprehensive understanding of the project's evolution.
Key Component 1
Intuitive Dashboard for Operator & Customizable Dashboard for Plant Manager with in-app communication
Insight...
"At the operator level, they should just be able to infer the information and make decisions. But at the engineer level, there should be like, an ability to customize."
To better understand the solution, let's see a scenario in the form of storyboard
Intuitive data visualization techniques such as graphs, charts, and color-coded indicators were used to make energy data easy to understand at a glance.
In-app Communication - The operator can create a ticket and inform the plant manager of an issue.
In-app Communication - The Plant Manager can review the ticket raised and help the operator. The plant manager can also check and review the previous ticket's status.
Key Component 2
AI-powered Analytics and Recommendation system
Insight...
"Operator should just be able to infer the information and make decisions."
- Stakeholder's perspective of user
To better understand the solution, let's see a scenario in the form of storyboard
The Energy Insight Advisor performs real-time analysis of energy consumption data, historical data, enabling timely detection of anomalies and deviations from expected patterns.
The Advisor not only identifies energy-related issues but also provides proactive recommendations to technicians and plant managers on how to address them effectively.
Key Components 3
Reducing dependency - Energy Efficiency Guides
Insight...
"Operators can make decisions on their own, but there can be training that can happen or protocols that can be followed ."
To better understand the solution, let's see a scenario in the form of storyboard
The dashboard has a Training Module section that provides videos for operators to access and learn from easily.
The training Module provides User Case Scenarios, which Operators, including those new to the system, can quickly understand and utilize.
The Training Module also provides Error Guides, which the Plant manager and the Operator can refer to and make informed decisions.
In case of system errors, operators can refer to the Energy Efficiency Guides to make informed decisions and resolve issues efficiently.
Feedback on Solutions & Prototype
The moderator guide served as a crucial tool to ensure consistency, structure, and objectivity throughout the user testing process, allowing for the collection of valuable, unbiased insights that directly informed our design decisions.
Plant Manager's approves the resolution steps
Insight
Operators does not rely on Plant Managers for issue resolution steps
Iteration
For issue resolution, show step-by-step instructions to operator. For energy measures, suggest PMs approved steps.
Impact
Reduces issue resolution time
Displaying issues along with the visualization
Insight
The issue/notification on the operator dashboard is not sufficiently noticeable.
Iteration
Use prominent visual cues such as color coding or pop-up notifications.
Impact
Increase visibility and accessibility
Providing resolution steps for an issue
Insight
Users expressed the desire to know the source of the generated information.
Iteration
Add source for the system proposed solution and provide options to change
Impact
Increases user trust and autonomy
Track and monitor issue resolution progress
Insight
Users found it difficult to find specific issues based on their needs
Iteration
Implement a filtering mechanism based on machine type, priority level, status. Also,incorporate sorting options, such as by date.
Impact
Improves user navigation
Business Aspect
How can this boost the business?
Business Viability | Technical Feasibility | Desirability
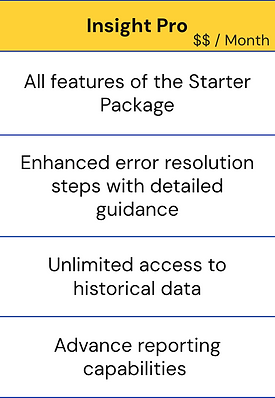
Business Model : Freemium


Cost Structure
To generate content for training materials
Drafting resolution guides for most common issues
Integrating analytical tools in the system
Business Viability
Reduces operational costs


